News

How to Prevent Baking Quality Complaints and Supply Chain Claims with a Reliable Falling Number

How to Pre­vent Bak­ing Qual­i­ty Com­plaints and Sup­ply Chain Claims with a Re­li­able Fall­ing Num­ber


How a Simple Enzyme Test Explains Major Quality Differences in Industrial BakeriesWhy the Baking Quality of Wheat Flour Is Not Always GuaranteedIn the food industry, every step of the production process is carefully monitored. Yet there are situations where finished products deviate from the standard, even though the recipe and processing remain unchanged. Think of dense bread, poor rise, or an unusual crumb structure. In many of these cases, the cause lies in the raw material itself: wheat flour.A crucial indicator for the processing properties of flour is the so-called Falling Number. This value reflects the enzyme activity in the flour and is of great importance for millers, QA managers, and industrial bakeries.What Is Falling Number and Why Is This Analysis So Important?The Falling Number analysis (NEN-EN-ISO 3093) determines the activity of the enzyme alpha-amylase in flour or milled grain. Alpha-amylase breaks down starch. When this process occurs too quickly, it leads to insufficient structure formation during baking.During the analysis, the time it takes for a stirring rod to fall through a heated starch solution is measured. High enzyme activity results in a watery solution and therefore a low Falling Number value. Low enzyme activity produces a thick paste and a higher value.Interpretation of Falling Number Results:Less than 200 seconds: excessive enzyme activity, risk of sticky or dense bread200 to 300 seconds: acceptable enzyme activity for standard applicationsMore than 350 seconds: low enzyme activity, risk of dry crumb or underbakingThis measurement is essential for quality assessment of grain batches and flour products. It enables companies to anticipate processing behavior, ensure consistency, and prevent complaints.Practical Example: Deviating Baking Results Due to Changed Enzyme ActivityAn industrial bakery reported sudden changes in bread volume and crumb structure of a standard product. Oven settings, mixing time, and yeast dosage were unchanged. Still, the bread performed below expectations.A Falling Number analysis showed that the flour used had a value of 190 seconds, while previous batches measured 290 seconds. This deviation indicated increased enzyme activity, likely caused by moist storage of the wheat or blending with undried batches.Based on this result, the miller was able to trace the cause and take measures in storage and blending strategy. The bakery temporarily adjusted with a tailored premix while tightening purchasing criteria.For Which Companies Is Falling Number Relevant?The Falling Number analysis is widely applicable in the food supply chain:Grain importers use it for classification and quality controlFlour producers set it as a standard in blends and batch acceptancePremix manufacturers use the value as a basis for recipe developmentIndustrial bakeries monitor it to prevent volume-related complaintsQA managers include the measurement in their raw material control planThe analysis at TLR is fully accredited under ISO/IEC 17025:2017 (scope L059).Conclusion: Measure Falling Number Before Complaints AriseSmall deviations in enzyme activity can have major effects on bread quality, processing behavior, and customer satisfaction. By using Falling Number analyses as a standard in the assessment of flour or grains, you can prevent supply chain issues and later claims.Whenever possible, request analysis from an accredited laboratory such as TLR to ensure the values are reliable and reproducible.Frequently Asked Questions About Falling NumberWhat is a good Falling Number value for standard wheat flour?A value between 200 and 300 seconds is considered optimal for most bread applications. Extremes should be avoided.How quickly is a Falling Number analysis available?At TLR, a standard analysis is usually available within 24 to 48 hours after sample receipt.What can affect Falling Number values?Harvest conditions, storage climate, moisture content, and wheat type directly influence enzyme activity and therefore the Falling Number.Step-by-Step: How a Falling Number Analysis WorksGrind the grain sample or use flour directlyWeigh a fixed amount and mix it with water to create a suspensionHeat the mixture until gel formation occursLet a stirring rod drop into the heated mixtureMeasure the time in seconds until the rod reaches the bottomInterpret the value based on the desired baking properties

28 July 2025
Scrutinizing Textile Claims with Fiber Identification and Material Analysis

Scru­ti­niz­ing Tex­tile Claims with Fiber Iden­ti­fi­ca­tion and Ma­te­ri­al Anal­y­sis

When certainty about fibers makes the difference between trust and doubt in your supply chainWhy material knowledge is becoming increasingly important in textilesThe textile sector is under pressure. Consumers demand transparency, brands communicate about sustainability, and certifications determine market access. In this context, the demand for objective material analysis is increasing.Fiber identification helps to determine exactly which raw materials are actually present in a fabric. This is essential for quality control, contract validation, certification verification, and dispute resolution.What does fiber identification involve?Fiber identification is the determination of the type of fibers in a textile sample. This is done through:Microscopy: visual comparison of fiber structureBurn and solubility tests: characteristic behavior when heated or in chemical reagentsFTIR spectroscopy: analysis of molecular bonds for synthetic fibersDNA or GMO tests: detection of genetically modified cotton or origin verificationThese methods make it possible to distinguish between cotton, polyester, viscose, wool, linen, acrylic, and blended compositions.Case: unexpected polyester mix in “100% cotton” textilesAn importer of bed linens had samples tested after a retailer complained about pilling and shrinkage. According to the label, the material was 100% cotton. Fiber identification, however, showed that the fabric consisted of 35% polyester.The error was traced back to the spinning mill: leftover material from other batches had been reused without updating the label. The test report allowed the importer to substantiate the problem, reject and repackage the batch, and notify the supplier of the contract breach.Without laboratory evidence, this would have been a difficult discussion.When is fiber identification valuable?This analysis is relevant for:Incoming goods inspection (verification of supplier claims)Certification audits (e.g., GOTS, Oeko-Tex, GRS)Complaint investigations from retailers or consumersValidation of specifications in private label productionLegal substantiation in disputes or recallsTLR is accredited for various fiber and material analyses. The combination of classic microscopic examination and modern chemical techniques ensures reliable, reproducible results.The importance of additional material analysisIn addition to fiber type, other material properties are often examined:Pesticide residues (for organic claims)Gossypol content (in cotton seeds)GMO analysis (in genetically modified cotton)Discoloration, shrinkage, pilling (under product stress)These parameters strengthen product information and make it possible to substantiate claims, labels, and certifications.Conclusion: textile analysis provides certainty in an opaque supply chainCertainty about material composition is not optional in a market where claims are quickly questioned. Fiber identification and material analysis help reduce risks, limit liability, and demonstrate supply chain control.Ensure that you have an analysis carried out immediately in case of discrepancies or doubt. The data reveals what the label sometimes conceals.Frequently asked questions about fiber identificationWhat is the minimum amount of material needed for analysis?A swatch of 5 × 5 cm is often enough for microscopy and solubility tests. Smaller amounts can be used for DNA or FTIR tests.Is it possible to identify blends?Yes, blends of natural and synthetic fibers can be quantified by type and percentage.Is this analysis carried out under accreditation?Yes, TLR performs fiber and material testing under ISO/IEC 17025, using validated methods.Step-by-step: how a textile analysis worksCollect a sample of the material (preferably without finishing or coating)Determine the fiber structure and material composition visually or chemicallyAnalyze for specific properties such as shrinkage, stretch, contamination, or GMOCompare with product specification, label, or contractReport deviations and discuss possible next steps

28 July 2025
Keeping Fat Quality in Check with Peroxide Value and Saponification Value

Keep­ing Fat Qual­i­ty in Check with Per­ox­ide Value and Saponi­fi­ca­tion Value

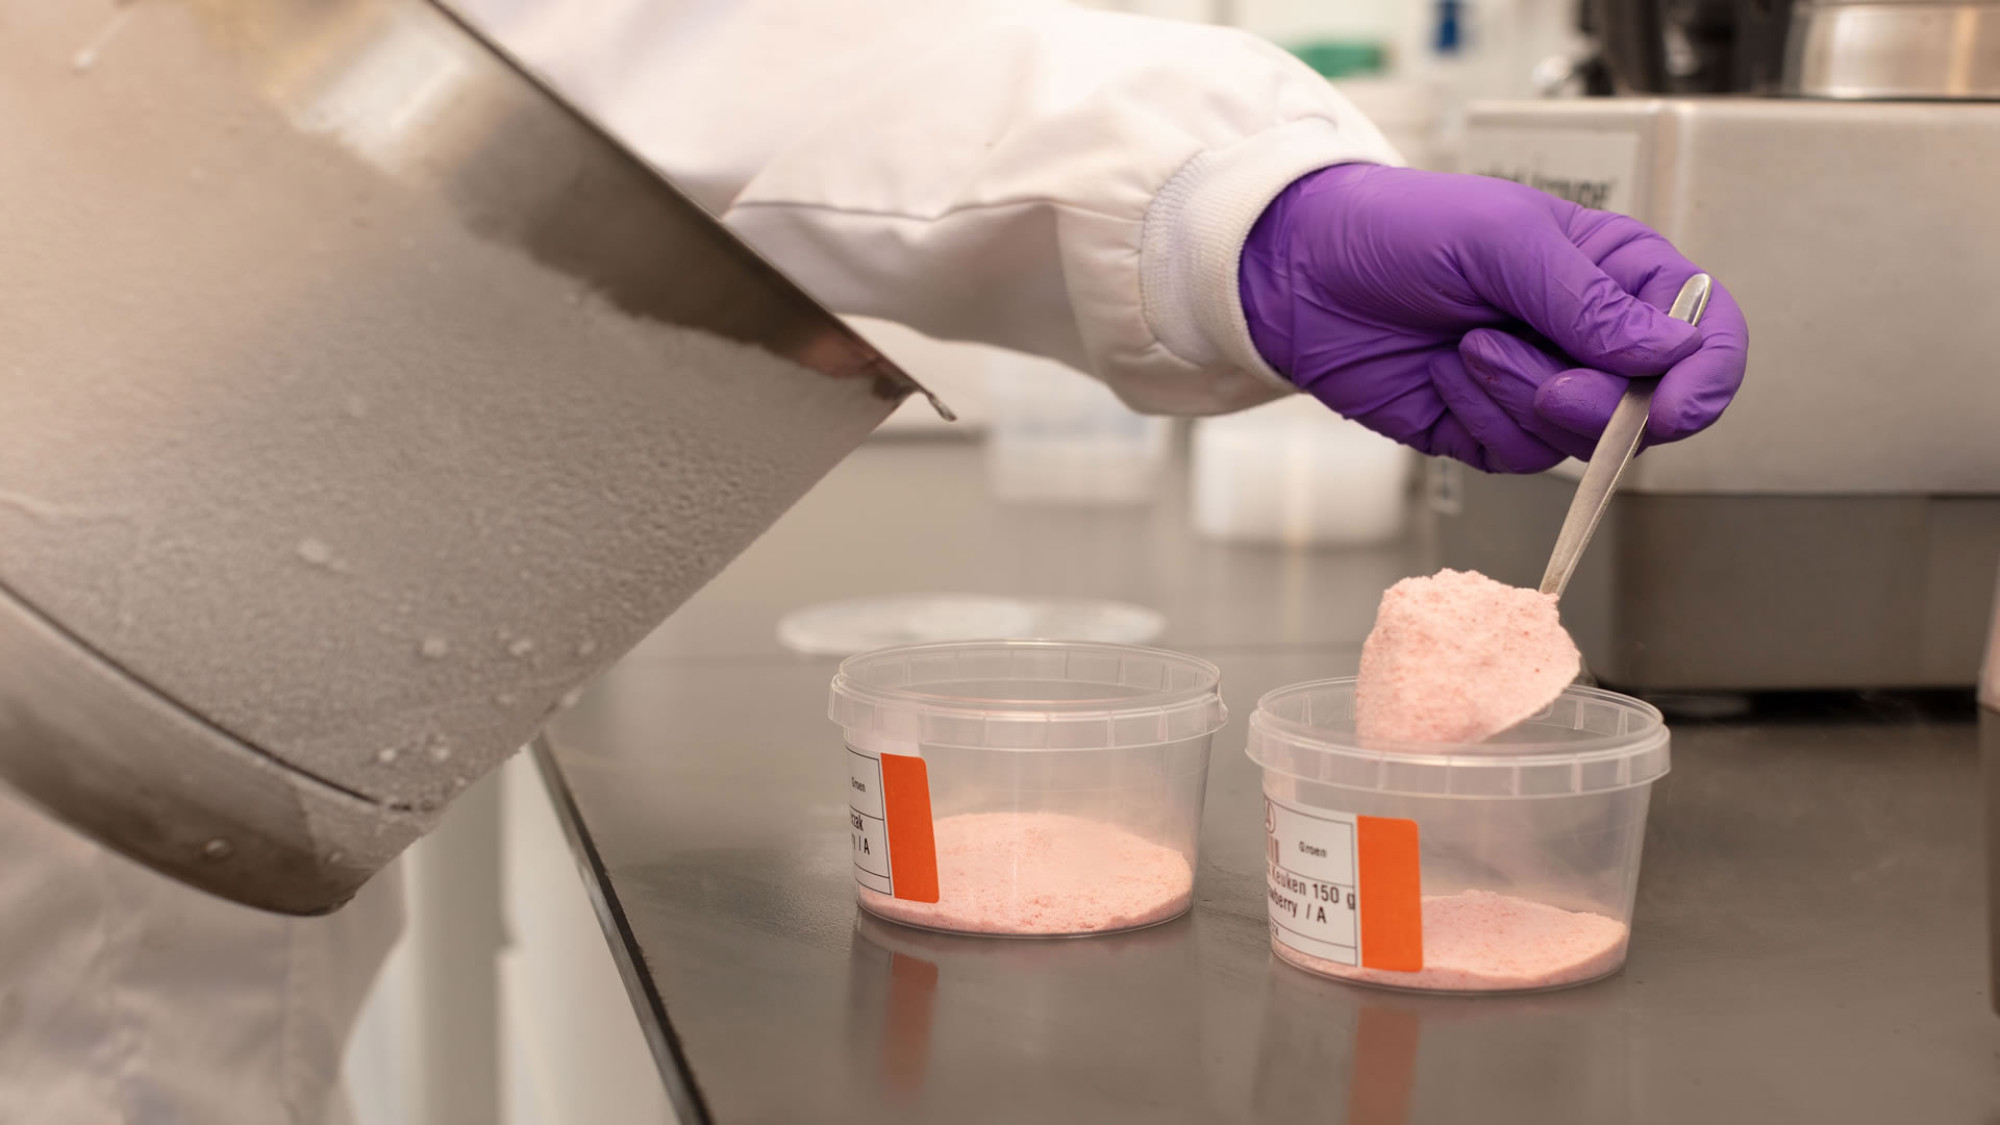
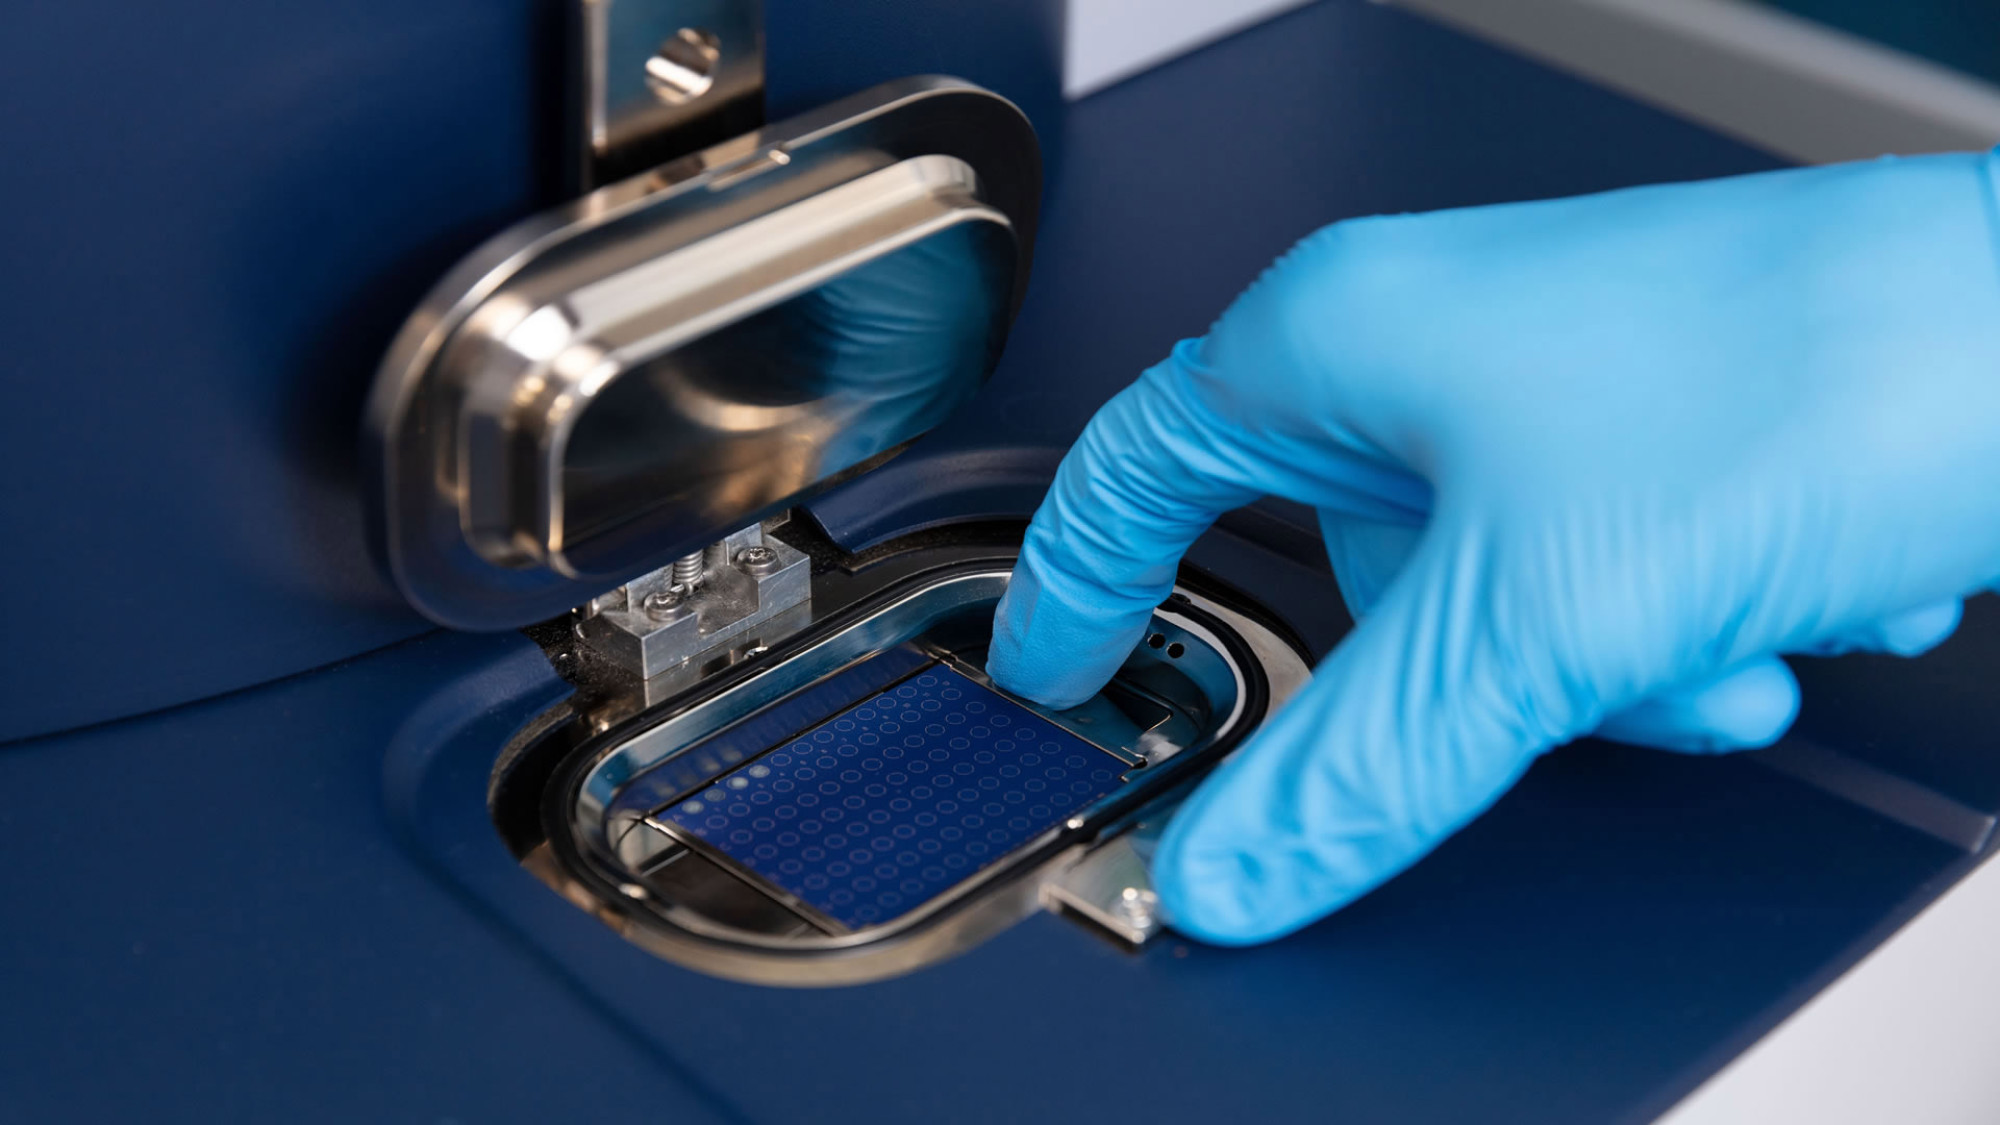
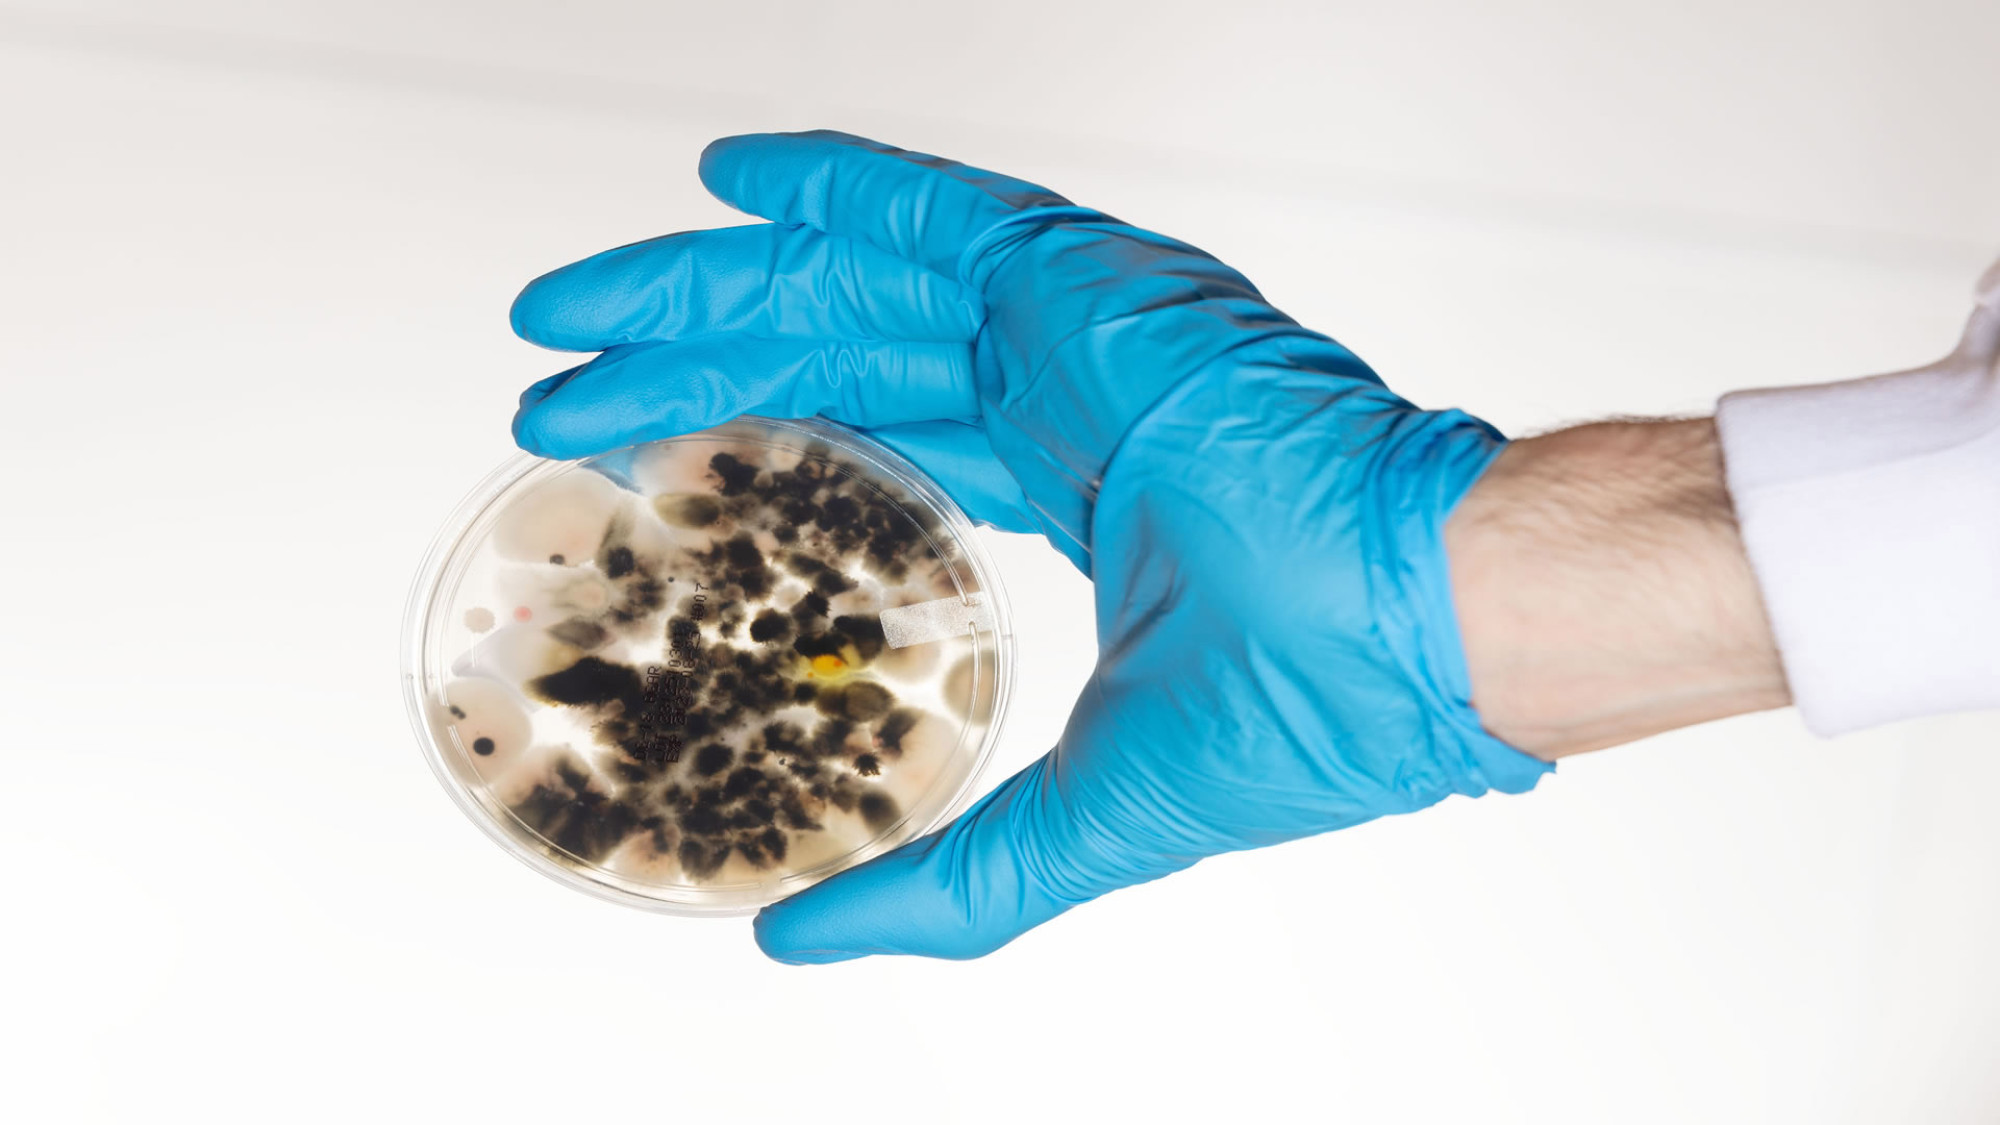
Why high-quality oils are only truly reliable with the right laboratory measurementsWhy fats are susceptible to quality lossFats are an essential ingredient in countless food products. However, their quality is far from guaranteed. Storage, transport, and origin play a crucial role in oxidation, off-flavours, or reduced functionality.Quality issues with fats are rarely detected in time—often only when products smell rancid, turn brittle, or consumers complain. Measurements such as the peroxide value and the saponification value help identify these risks at an early stage.What does the peroxide value say about fat quality?The peroxide value measures the amount of peroxides: the first breakdown products in fat oxidation. A higher value indicates the start or progression of spoilage, with direct consequences for aroma, taste, and shelf life.Indicative values (meq O₂/kg fat):0 to 5 = fresh fat, good quality5 to 10 = beginning of oxidation10 = oxidised, not suitable for consumptionThis measurement is an essential indicator of freshness, but it says nothing about the original composition. That’s why it’s also important to determine the saponification value.What does the saponification value reveal about composition?The saponification value measures how much potassium hydroxide is needed to completely saponify the fat. This provides insight into the fatty acid chain length and thus the origin or possible adulteration.High saponification values indicate short-chain fatty acids (e.g., coconut oil)Low saponification values indicate long-chain fatty acids (e.g., fish oil)The value acts as a fingerprint of a fat type. Deviations can indicate blending with cheaper oils or labelling errors. This analysis is often used in trade disputes or to validate specifications.Additional analyses for fat stabilityIn addition to peroxide value and saponification value, other parameters provide extra insight:Anisidine value: measures secondary oxidation productsTOTOX value: the sum of both, indicating the total oxidation levelAcid value: indicates hydrolysis and free fatty acidsIdeally, these measurements are combined to assess the full oxidation profile of an oil or fat.Case study: margarine complaint leads to revised storage protocolA manufacturer of industrial margarine received complaints from bakers about unusual smell and spreadability. Initially, a recipe error was suspected.Laboratory testing, however, showed a peroxide value of 12.5 meq O₂/kg, above the permitted limit. The saponification value also deviated from the reference file, indicating adulteration.The cause was traced to a storage logistics error at the supplier. The oil had been exposed to temperature fluctuations, accelerating oxidation. In addition, the supplied sunflower oil was partially mixed with soybean oil.With the accredited test reports, the manufacturer was able to reject the batch and hold the supplier accountable.Who benefits from these analyses?These fat analyses are important for:QA teams of food manufacturersBuyers of vegetable and animal fatsPrivate label suppliers with export obligationsProduct developers of sauces, margarines, supplementsLaboratories and audit teams in trade inspectionsAll analyses are included in TLR’s ISO/IEC 17025 accreditation (scope L059), under methods TL382.24A (peroxide value) and TL382.28 (saponification value).Risks of skipping fat analysesLabelling errors go unnoticedRancidity causes complaints or returnsFraud (adulteration) remains undetectedLegal claims are harder to substantiateBy testing regularly, you prevent supply chain damage and protect your product’s reputation.Conclusion: fat quality should be based on data, not smellAn oil that looks clear today may be oxidised tomorrow. By consistently measuring peroxide value and saponification value, you safeguard quality, origin, and stability. These parameters make the difference between gut feeling and analytical proof.Have analyses carried out by an accredited laboratory to ensure results are defensible in audits, claims, and corrective processes.Frequently asked questions about fat analysesWhat is the difference between peroxide value and saponification value?The peroxide value measures oxidation, while the saponification value provides information about the fatty acid composition.What is the standard for peroxide value?For edible fats, a limit of <10 meq O₂/kg is generally used, depending on the product type.Can adulteration with cheaper oil be detected?Yes, deviations in saponification value or iodine value can indicate blending.Step-by-step: how a fat analysis worksTake a representative sample of the oil or fat productDetermine the peroxide value via titrimetry (NEN-EN-ISO 3960)Measure the saponification value (NEN-EN-ISO 3657)Compare with product specifications or standard valuesReport deviations and assess risksUse results for claims, corrective measures, or supply chain management

28 July 2025
Nutritional Analysis as the Basis for Labelling and Product Development

Nu­tri­tion­al Anal­y­sis as the Basis for La­belling and Prod­uct De­vel­op­ment

Waarom nauwkeurige analyse cruciaal is voor vertrouwen in je productlabelEtikettering begint niet bij marketing, maar in het laboratoriumEen etiket is veel meer dan verpakking: het is een wettelijk document, een belofte aan de consument en een toetsingspunt voor inspecties. Toch worden fouten in voedingswaarden nog vaak pas opgemerkt als het al te laat is: bij recalls, afkeur op exportmarkten of onduidelijkheid rond gezondheidsclaims.Om die risico’s te vermijden, is voedingswaardenonderzoek essentieel. Niet via rekenmodules of verouderde databases, maar via representatieve monsters en geaccrediteerde meetmethoden.Wat wordt onderzocht bij voedingswaardenbepaling?Een standaard voedingswaardenonderzoek richt zich op de zogeheten Big 8:Energie (kcal/kJ)EiwitKoolhydratenSuikersVetVerzadigd vetVezelZout (natriumgehalte)Daarnaast kunnen aanvullende parameters worden bepaald, zoals:Vitamines (bijv. B12, D, E)Mineralen (zoals calcium, ijzer, magnesium)AlcoholgehalteOrganische zurenDeze gegevens vormen de basis voor de verplichte voedingswaardetabel volgens Verordening (EU) 1169/2011.Casus: verschil tussen label en lab leidt tot recall in exportmarktEen producent van plantaardige eiwitdranken liet routinematig de voedingswaarden berekenen op basis van grondstofspecificaties. Bij export naar Scandinavië eiste de afnemer een geverifieerd labrapport.Het onderzoek wees uit dat het daadwerkelijke suikergehalte 17% hoger lag dan opgegeven, en het eiwitgehalte 10% lager. Dit had gevolgen voor zowel de gezondheidsclaim (“hoog in eiwit”) als de energiewaarde op het etiket.De partij werd teruggetrokken, de verpakking aangepast en het QA-protocol uitgebreid met halfjaarlijkse labanalyses.Waarom kiezen voor laboratoriumanalyse in plaats van berekening?Berekeningen op basis van recepturen en databases zijn alleen betrouwbaar als:Ingrediënten constant van samenstelling zijnEr geen thermische verwerking plaatsvindtEr geen fermentatie, enzymatische splitsing of mengveranderingen optredenZodra producten worden gebakken, gefrituurd, geconserveerd of gefermenteerd, ontstaan significante afwijkingen tussen theoretische waarden en meetwaarden. Alleen een geaccrediteerde analyse geeft dan juridisch houdbare en marktconforme cijfers.Hoe wordt voedingswaardenonderzoek uitgevoerd?TLR voert deze onderzoeken uit onder accreditatie (scope L059), met gebruik van:Kjeldahl-methode voor eiwitSoxhlet of zure hydrolyse voor vetTitratie voor suikersCalorimetrie of berekening op basis van geanalyseerde waardenNEN- en ISO-normen conform Europese wetgevingDe combinatie van chemische analyse en controlemonsters zorgt voor reproduceerbare, auditbestendige rapporten.Voor wie is dit onderzoek verplicht of sterk aanbevolen?Producenten van retailproducten (etikettering verplicht vanaf >1 ingrediënt)Private label leveranciers met contractuele eisenExporteurs richting markten met aanvullende regelgeving (zoals Scandinavië, Zwitserland, VS)Voedingsbedrijven met gezondheidsclaims of nutrient profilingOntwikkelaars van nieuwe producten of reformuleringenTLR biedt ook ondersteuning bij heretikettering, batchvergelijking en verificatie na receptwijziging.Conclusie: een sterk label begint met een sterk labrapportVertrouwen in je product begint bij de cijfers achter je etiket. Voedingswaardenanalyse maakt niet alleen je verpakking betrouwbaar, maar voorkomt ook juridische risico’s en marktverliezen.Maak voedingsanalyse tot een vast onderdeel van je QA-proces. Niet omdat het moet, maar omdat het loont.Veelgestelde vragen over voedingswaardenonderzoekIs voedingsanalyse verplicht voor elk product?Ja, zodra je voedingsmiddelen op de markt brengt met meer dan één ingrediënt, is een voedingswaardetabel wettelijk vereist.Mag ik voedingswaarden berekenen i.p.v. laten meten?Alleen als het recept stabiel is en niet wordt verwerkt. Bij twijfel of export is laboratoriumanalyse sterk aanbevolen.Welke analysemethoden worden gebruikt?TLR werkt met geaccrediteerde NEN- en ISO-methodes, waaronder NEN-ISO 1443 (vet), NEN-ISO 937 (eiwit), ISO 6865 (vezel).Stappenplan: zo werkt voedingswaardenonderzoekVerzend een representatief monster of batchLaat analyseren op de Big 8 en eventueel extra parametersOntvang een geaccrediteerd labrapport met alle waardenGebruik dit rapport voor etikettering, productspecificatie en auditverantwoording

28 July 2025
Resolving fluctuating feed mix and inconsistent performance in pig feed with DNA analysis

Re­solv­ing fluc­tu­at­ing feed mix and in­con­sis­tent per­for­mance in pig feed with DNA anal­y­sis

Resolving fluctuating feed mix and inconsistent performance in pig feed with DNA analysis – How molecular identification uncovers surprising causes in feed qualityWhen standard analyses provide no clear causePig farmers report reduced feed intake, unusual odours, and inconsistent behaviour in their barns. The technical team of a compound feed manufacturer checks the formulation, repeats standard determinations for protein, fat, and moisture, but finds no direct deviation. Yet, the complaint persists, batch after batch.In such a case, DNA analysis can provide the answer. Where classical analytical methods stop at chemical composition, DNA identification looks at the biological origin of ingredients. This approach is becoming increasingly important in a market where by-products, blending, and global sourcing are the norm.What does a DNA analysis in animal feed do?DNA analysis in feed products makes it possible to identify plant or animal species at the molecular level. Using PCR technology (Polymerase Chain Reaction), traces of DNA sequences are amplified and compared with reference profiles.Practical applications:Origin verification of plant components (e.g. soy, maize, wheat)Detection of non-permitted animal ingredientsIdentification of contamination by unwanted speciesComposition checks with suppliers or external mixersIn the case of inconsistent pig feed performance, a DNA profile can reveal, for example, a switch from maize to sorghum, or the presence of grasses not listed in the product specification.Case study: unexplained feed complaints at a GMP+ certified producerAn animal feed producer faced recurring complaints about off-odours and reduced feed intake in a specific production line for finishing pigs. The GMP+ documentation was fully in order. Analyses of moisture, fat, and protein were within specifications.An additional DNA analysis revealed that a new batch of soy from a different region contained traces of lupin and field bean. These legumes were undeclared, had been processed by the same supplier, and affected both the smell and digestibility of the product.Following this discovery, the supplier adjusted its segregation protocol, and the producer tightened specification requirements. The use of DNA analysis established the origin and composition with certainty.When is DNA analysis of animal feed valuable?DNA profiles are particularly useful in situations where classical parameters are insufficiently distinctive:In cases of persistent complaints without clear chemical deviationsFor traceability in complex raw material supply chainsWhen fraud or incorrect labelling is suspectedAs a control element in private schemes or international tradeTLR performs DNA analyses under ISO/IEC 17025 conditions within accredited laboratory environments, following current methodological standards.Conclusion: use DNA as a control tool for unexplained complaintsA feed mix can meet all standard criteria and still cause abnormal behaviour in the barn. In such cases, DNA analysis offers a deeper view into the biological identity of ingredients. This approach enhances traceability, supports risk management, and helps producers proactively manage consistent feed quality.Request a DNA screening when complaints are persistent but analytical values offer limited explanation. Insights from molecular research can help refine your supplier policy and increase the reliability of your feed matrix.Frequently asked questions about DNA analysis in animal feedWhat types of deviations can DNA analysis detect?Incorrect plant or animal species, undeclared ingredients, contamination, or mixing with unknown components.Is DNA analysis accredited for animal feed testing?Yes, TLR conducts DNA analyses under ISO/IEC 17025 and uses validated PCR methods.Is DNA testing also used in legal disputes?Yes, it provides objective and reproducible results that can be used in claims or quality disputes.Step-by-step: how DNA analysis works on feed productsCollect a representative sample of the feed or raw materialExtract DNA using specialised equipmentAmplify specific gene fragments using PCR technologyCompare with reference DNA from recognised databasesReport which species are detected, including any contaminationUse the report for corrective actions, validation, or supply chain adjustments

28 July 2025
close

Meld je aan voor de laatste tips en adviezen dat je gelijk in de praktijk kunt brengen.